
We now have KubeBolt 1.23.1 running as an in-cluster agent on OpenShift 4.20 with Kubernetes 1.33.6. Reaching the Active state, however, took more than installing the official Helm chart.
Two independent problems appeared during the integration. The first affected the startup of kubebolt-web under OpenShift security restrictions. The second was less obvious: KubeBolt reached the API Server, authenticated and queried resources normally, but declared the cluster unreachable about 25 seconds later.
The decisive clue appeared when we measured each resource separately. The Events endpoint returned HTTP 200, but delivered 144,641,645 bytes—approximately 138 MiB.
The environment under test
The installation combined:
- KubeBolt 1.23.1 installed with its official Helm chart;
- OpenShift 4.20 and Kubernetes 1.33.6;
- KubeBolt running inside the cluster;
- 5 nodes, 77 namespaces, 373 observed pods and 67 deployments;
restricted-v2as the original SCC.
The goal was for KubeBolt to discover and analyse the environment through its own ServiceAccount. Separating the two failures from the start mattered: their appearing during the same deployment did not mean they had the same cause.
First problem: kubebolt-web versus restricted-v2
The web container entrypoint tried to modify this file during startup:
/etc/nginx/conf.d/default.confUnder restricted-v2, the operation ended with an error equivalent to:
sed: can't create temp file ... Permission deniedWe limited the test to kubebolt-web: we created a dedicated ServiceAccount and authorised it to use anyuid. The component started, while kubebolt-api and VictoriaMetrics continued to run under restricted-v2.
This result does not make anyuid a universal recommendation. It was a controlled exception for one component whose entrypoint required behaviour incompatible with the original security context. Red Hat documents that anyuid permits any UID and GID, while restricted-v2 drops capabilities, applies runtime/default and prevents privilege escalation. That difference is why the exception should be granted cautiously and with the narrowest possible scope instead of modifying the default SCCs.
kubebolt-web      → dedicated ServiceAccount and controlled exception
kubebolt-api      → restricted-v2
VictoriaMetrics  → restricted-v2
An application being designed for Kubernetes does not mean it should receive broad permissions to run on OpenShift. In this case, relaxing security for the entire installation was unnecessary.
Kubernetes responded, but the cluster appeared unreachable
Once the frontend issue was isolated, KubeBolt correctly detected the in-cluster configuration. The backend reached kubernetes.default.svc, ran SelfSubjectAccessReview and completed its permission check.
26/31 resource types accessibleThe sequence looked normal until, approximately 25 seconds later, this appeared:
connect timed out after 25s for context in-cluster — agent may be stuckThe interface represented that state as Cluster unreachable. The message made DNS, certificates, NetworkPolicy, the ServiceAccount token and RBAC reasonable things to inspect, but the available data did not yet prove any of those hypotheses.
Validate before changing RBAC
We ran checks from a pod using the same kubebolt ServiceAccount. kubernetes.default.svc resolved correctly, and authenticated requests worked against:
/version
/api/v1/nodes
/api/v1/pods
Nodes, Pods, Deployments, Services, StatefulSets, DaemonSets and Jobs responded normally and, in these tests, generally in under one second.
That evidence was enough to stop treating general connectivity, DNS, authentication or a global RBAC failure as the primary hypothesis. It did not prove that every possible network problem was impossible. It proved something more useful: the same client, identity and path to the API Server worked with several real resources.
Kubernetes recommends assigning a specific ServiceAccount to each workload and granting only the required permissions through RBAC. That also defined the boundary of our test: do not expand the ClusterRole indiscriminately; identify which resource behaves differently (official ServiceAccount documentation).
The outlier was Kubernetes Events
Querying resources individually exposed a clear difference:
oc get events -AThe operation took between 32.4 and 32.5 seconds. We then sent a direct HTTP request to:
/api/v1/eventsThe observed result was:
HTTP 200
Approximate time: 6.35 s
Transfer: 144,641,645 bytes
About 138 MiB of Events in a single response. The endpoint was not broken: it responded successfully, but returned a volume extraordinarily larger than the other measured resources.
The difference between the direct request’s 6.35 seconds and the more than 32 seconds taken by oc get events -A also warned against treating “HTTP response time” and “the total time a client needs to receive, decode, render or synchronise the objects” as equivalent. They measured different operations.
Why a successful response can delay an informer
A Kubernetes informer maintains a local view of resources and receives subsequent changes. In simplified terms, its startup usually involves:
- performing an initial
LIST; - receiving and deserialising the objects;
- storing them in the local cache;
- establishing the
WATCH; - waiting for the cache to report that it has synchronised.
Kubernetes uses consistent list operations and watch streams so clients can maintain synchronised state. For large collections, the API supports pagination through limit and continue, specifically to avoid monolithic responses that burden the server and client (Kubernetes API concepts).
We did not inspect KubeBolt’s internal code or prove exactly how it implements pagination, informers or the initialisation deadline. The interpretation must stay within what the data supports:
The results strongly suggest that the initial Events load delayed the informer or cache synchronisation until it exceeded the 25-second limit used during context initialisation.
This explanation is consistent with the A/B test. It is not the same as claiming a confirmed bug in KubeBolt’s informer.
The A/B test: remove one variable
To test the relationship, we changed only KubeBolt’s ClusterRole. We removed events from the rule granting:
get
list
watch
We did not remove access to Pods, Nodes, Deployments or any other relevant resource. We then restarted the backend.
The permission probe changed from:
26/31 resource types accessibleto:
25/31 resource types accessibleThat reduction was expected. The decisive change appeared about 1.8 seconds later:
Informer caches syncedThe timeout disappeared, and the interface changed from Cluster unreachable to Active.
With Events
KubeBolt starts context
        ↓
Permission probe
        ↓
Informer initialisation
        ↓
Cluster-wide Events LIST (~138 MiB)
        ↓
Receive / deserialise / cache / synchronise
        ↓
25-second limit exceeded
        ↓
Context timeout
Without Events during the test
KubeBolt starts context
↓
Permission probe
↓
Core informers
↓
Caches synchronised (~1.8 s)
↓
Cluster ActiveOnly one variable changed. That is why this comparison provided better evidence than expanding timeouts, permissions and network exceptions simultaneously.
From unreachable to Active
After the test, KubeBolt correctly displayed the environment’s inventory and general state:
- 5/5 Nodes;
- 67/67 Deployments;
- 77 Namespaces;
- Pods, workloads and storage;
- cluster metrics and capacity.
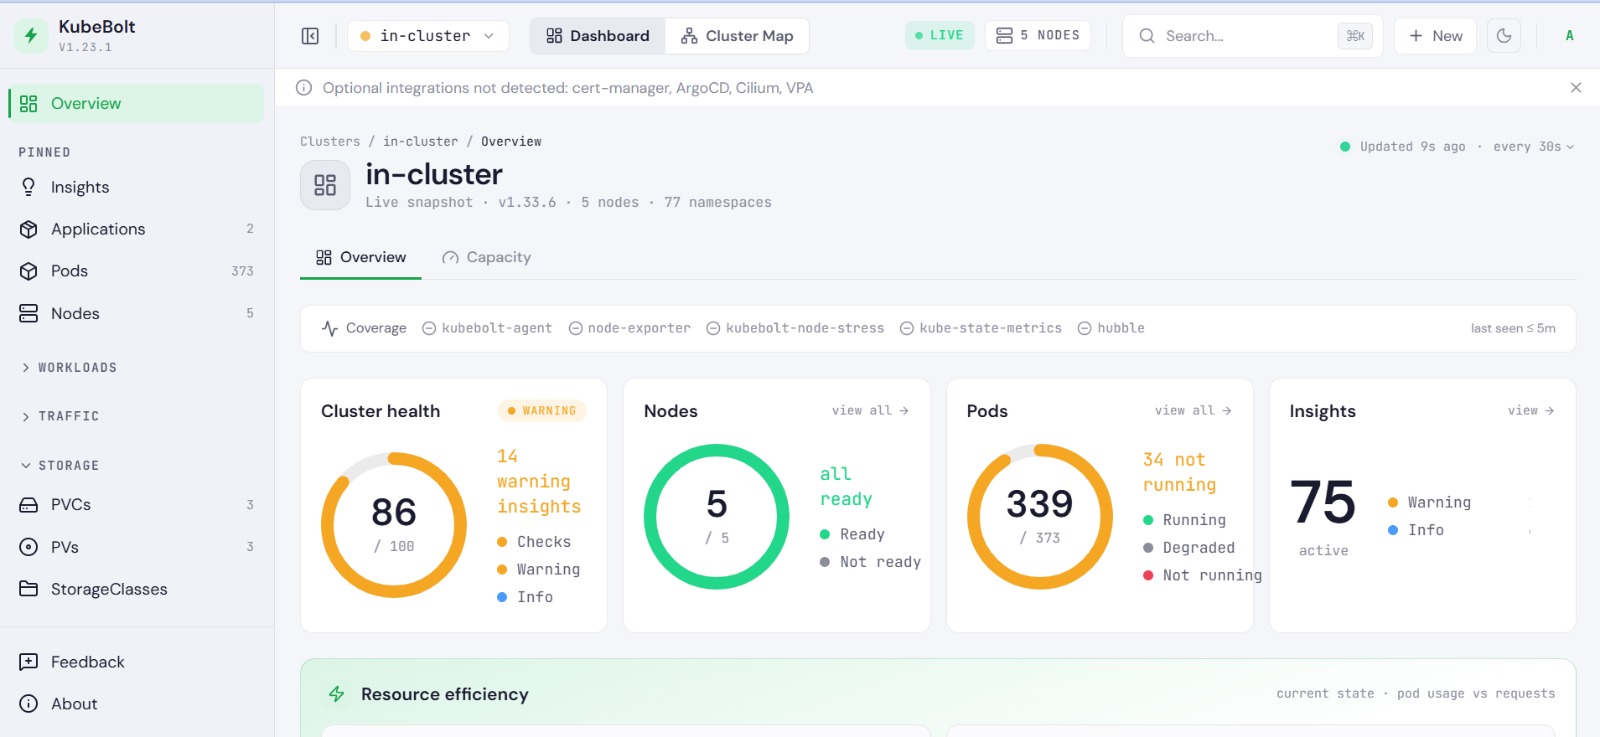
The observational conclusion is precise: with Events authorised, the timeout appeared; after removing only that resource, the core caches synchronised and the context became active. Establishing which exact part of the internal cycle consumed the time would require instrumentation or a review of the KubeBolt code.
This is the same distinction we apply when designing actionable Kubernetes alerting: detecting the symptom and explaining the mechanism are separate phases.
The timeout is not always where the error suggests
connect timed out directs an investigation towards DNS, firewalls, NetworkPolicy, certificates, ServiceAccount or RBAC. That is a reasonable first reading, but a timeout can also describe an operation that started successfully and did not finish within the expected window.
These facts coexisted in this environment:
API Server reachable
Authentication OK
RBAC operational for the tested resources
Resources accessible
with this interface state:
Cluster unreachableA consistent explanation is that “connected” depended not only on reaching the API Server, but also on completing a subsequent initialisation and synchronisation phase. The distinction matters: a global unavailability label can hide the fact that the control plane responds and that the delay belongs to one specific resource or phase.
Improvements worth evaluating
The following are proposals derived from the lab, not claims about the current implementation or requirements for KubeBolt.
Paginate the initial Events LIST
If the initial list is currently unpaginated, limit and continue would allow the collection to arrive in chunks. This does not eliminate the total volume, but it reduces each response and can make network, memory and deserialisation work more predictable.
Synchronise Events after essential resources
Nodes, Pods, Deployments and Namespaces may be enough to declare the basic context available. Events could synchronise afterwards:
Core informers synced
        ↓
Cluster Active
        ↓
Events syncing in background
Separate connection from synchronisation
Distinct messages would make the affected phase easier to locate:
Kubernetes API reachable
Informer sync pending: Events
This is operationally more precise than Cluster unreachable when the API Server has already responded.
Make the initialisation window configurable
The required time can vary with cluster size, object count, API Server latency and Events volume. A configurable timeout would make that window adaptable, although it would not replace identifying the slow resource.
Allow partial degradation
If Events fails or takes too long, KubeBolt could evaluate keeping Nodes, Pods, Deployments and metrics available. Explicit degradation preserves useful information and avoids necessarily allowing one secondary informer to determine the global state.
What we learned from taking the integration to OpenShift
OpenShift adds specific controls for dynamic UIDs, filesystem writes, capabilities, SCCs, ServiceAccounts and RBAC. Ignoring them leads to two unhelpful extremes: assuming any Kubernetes chart will work without adaptation, or granting broad permissions until it starts.
The applied solution was narrower:
kubebolt-web      → controlled exception
kubebolt-api      → restricted-v2
VictoriaMetrics  → restricted-v2
We applied the same discipline to the second problem: do not expand RBAC or change the network without evidence. In environments where security and operability must coexist, this isolation work is part of our Red Hat OpenShift consulting & operations, specialised Kubernetes support, and a Platform Engineering practice with explicit boundaries.
Result and method
KubeBolt 1.23.1 was left running as a local agent inside OpenShift 4.20. The cluster appeared active, and the platform displayed nodes, pods, deployments, namespaces, workloads, storage, metrics and general state.
The useful finding was not merely getting the deployment to start. It was showing that behind connect timed out there was a reachable API Server delivering approximately 138 MiB of Kubernetes Events.
The diagnostic sequence was deliberately simple:
isolate → measure → compare → remove one variable → measure againWe validated resolution, authentication and API Server access; checked RBAC against real resources; measured each collection; identified the outlier and ran an A/B test. That allowed the hypothesis to change without altering the configuration indiscriminately.
Deploying Kubernetes is one part of the job. Understanding what happens when real-world cases stop looking like a lab is where platform engineering begins.